Phenotype simulation
The below demonstrates the simulation of
- Binary trait
- Quantitative trait
- Ordinal categorical trait
- Time-to-event trait (to be updated)
The phenotype data system.file("extdata", "simuPHENO.txt", package = "GRAB") is simulated as below line by line.
First, we simulate covariates data frame in R
library(GRAB)
set.seed(678910)
FamFile = system.file("extdata", "simuPLINK.fam", package = "GRAB")
FamData = data.table::fread(FamFile)
IID = FamData$V2  # Individual ID
n = length(IID)   # sample size
Covar = data.table::data.table(IID = IID,
                               AGE = rnorm(n, 60),
                               GENDER = rbinom(n, 1, 0.5))
Then, we simulate linear predictors eta
beta.AGE = 0.5
beta.GENDER = 0.5
Covar = Covar %>% mutate(eta = beta.AGE * AGE + beta.GENDER * GENDER)
To simulate phenotypes for subjects with a given family structure, please add a random effect to the linear predictors eta as below.
bVec = GRAB.SimubVec(500, 50, "10-members", tau = 1)
Covar = merge(Covar, bVec)
PhenoData = Covar %>% mutate(eta = eta + bVec)
Next, we simulate phenotypes using eta
A. binary trait
PhenoData = PhenoData %>% mutate(BinaryPheno = GRAB.SimuPheno(eta, traitType = "binary",
                                                              control = list(pCase=0.1)),
                                                              seed = 1)
PhenoData %>% select(BinaryPheno) %>% table()
# BinaryPheno
#   0   1
# 881 119
B. quantitative trait
PhenoData = PhenoData %>% mutate(QuantPheno = GRAB.SimuPheno(eta, traitType = "quantitative",
                                                             control = list(sdError=1)))
C. ordinal categorical trait
PhenoData = PhenoData %>% mutate(OrdinalPheno = GRAB.SimuPheno(eta, traitType = "ordinal",
                                                               control = list(pEachGroup = c(8,1,1))))
# OrdinalPheno
#   0   1   2
# 801 109  90
D. time-to-event trait
TimeToEventPheno = GRAB.SimuPheno(PhenoData$eta, traitType = "time-to-event", control = list(eventRate = 0.1))
PhenoData = cbind(PhenoData, TimeToEventPheno)
The simulated phenotype data is as below
head(PhenoData)
# Key: <IID>
#         IID      AGE GENDER      eta       bVec BinaryPheno  seed QuantPheno
#      <char>    <num>  <int>    <num>      <num>       <int> <num>      <num>
# 1:   Subj-1 59.61118      0 29.59961 -0.2059781           0     1 -0.4837045
# 2:  Subj-10 61.31636      0 29.32101 -1.3371678           0     1 -3.2131581
# 3: Subj-100 59.16625      0 29.90944  0.3263173           0     1  0.4453062
# 4: Subj-101 60.18490      1 28.99876 -1.5936861           0     1 -1.2842710
# 5: Subj-102 58.76700      1 27.90020 -1.9832990           0     1 -1.5138808
# 6: Subj-103 59.98608      1 29.11236 -1.3806732           0     1 -0.3199512
#    OrdinalPheno   SurvTime SurvEvent
#           <num>      <num>     <num>
# 1:            0 0.04815559         0
# 2:            0 0.06259781         0
# 3:            0 0.03009825         0
# 4:            0 0.01281380         0
# 5:            2 0.19564637         0
# 6:            0 0.08905056         0
Output the simulated phenotypes to a file
extDir = tempdir()
extFile = file.path(extDir, "simuPHENO.txt")
data.table::fwrite(PhenoData, extFile,
                   row.names = F, quote = F, col.names = T, sep = "\t")
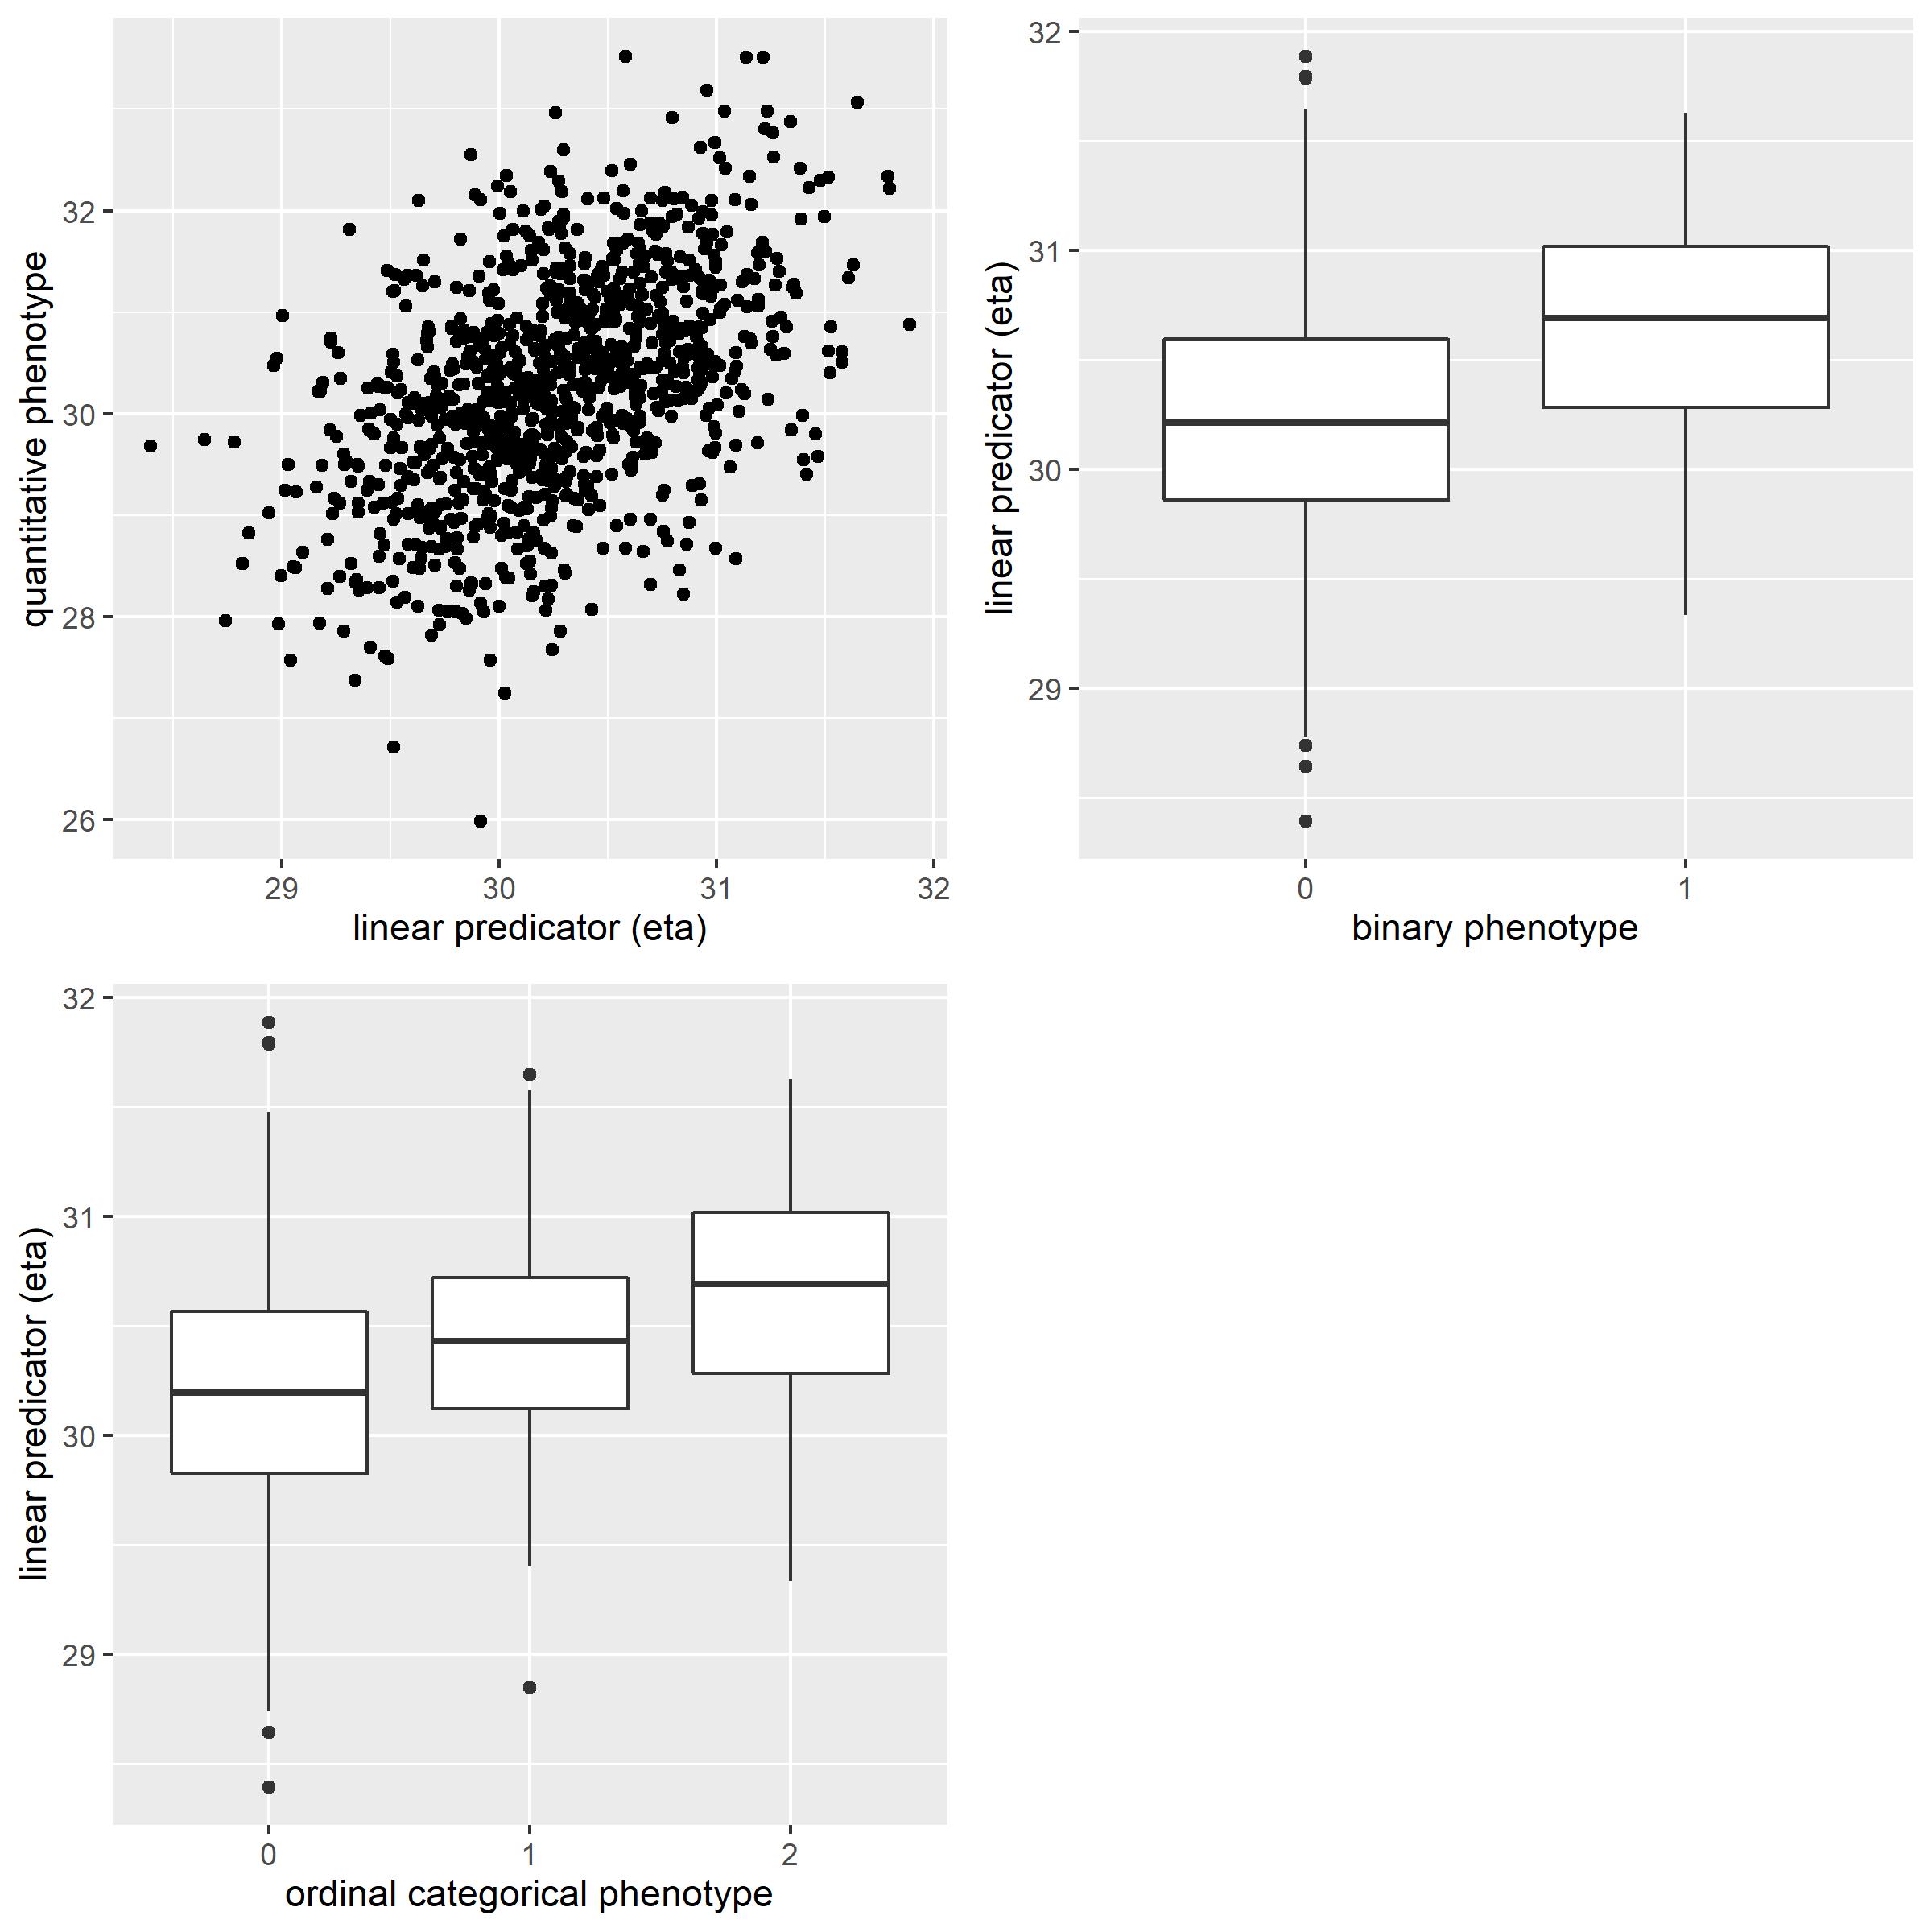
The distribution of simulated phenotypes
The distribution of simulated phenotypes compared to linear predicators eta is as below.
- quantitative phenotype: positive correction between
etaand phenotypes - binary phenotype: higher
eta, higher possibility of being cases - ordinal categorical phenotype: higher
eta, higher possibility of being groups with larger number
